Stereology workflow
Using Stereo Investigator it is possible to get accurate and reliable measures of total cell number, average neurite length and average degree of branching for neurons grown on coverslips.
To do this, two separate stereological probes are used – Fractionator and Petrimetrics.
- Fractionator is a probe used to accurately estimate cell numbers when there is only a 2-dimensional layer of cells (if you are working in tissues sections you will need to use the Optical Factionator probe). The fractionator can also be used to count branch points.
- Petrimetrics is a probe which uses line intersections to measure the length of lines in 2D (e.g. neurites/projections)
Petrimetrics – 3,4-Methylenedioxy-N-methamphetamine (ecstasy) promotes the survival of fetal dopamine neurons in culture
Jack W. Liptona, , , Emeline G. Toloda, Valerie B. Thompsonb, Lin Peia, Katrina L. Paumierb, Brian T. Terpstrab, Kaari A. Lyncha, Timothy J. Collierc, Caryl E. Sortwellc
STEP 1: Run the Fractionator on the coverslip to determine cell numbers
- Open Stereo Investigator and adjust the camera settings as neccessary to view the sample.
- Place the reference point in a easy to locate position.
- Draw a closed contour around the area of the coverslip using a low magnification objective (2.5 or 5x). If the sample is fluorescent, use a bright easy to see marker like DAPI for this step.
- Define the counting frame size (in the menu: Probes>Define Counting Frame) – you will need to define a counting frame size to suit the spacing of the cells you are counting. Adjust the counting frame so that you count no more than 3 – 5 cells per frame.
- Define the grid size (determines how much the counting frames will be placed over the coverslip) – (in the menu: Probes>Preview SRS Layout). Typically it is good to aim for at least 300 cells (e.g. 100 sites) but if cells are very homogenous then fewer than 100 cells may yield accurate results. Oversampling on the initial study and using resample oversample will give insight into the amount of sites necessary to give accurate results.
- Start the Fractionator probe (in the menu: Probes>Fractionator). This will include the frame size, and the grid size, which you have already determined
- If you are happy with these settings click OK
- The software will now take you to each each sampling site
- Use one of the markers to click each cell which falls within the counting frame – be sure to consistently follow the rules for using the counting frame
- Once you have completed counting cells in the first counting frame press F2 to move to the next frame
- If it is necessary to stop the fractionator mid way through – in the menu: Probes>Fractionator
- Once all the sites have been visited you can view the results of the probe run – (in the menu: Probes>Display Probes Run List).
Other Information about the Fractionator
- A second count can be used simulateously whilst counting cells to count the number of branching points seen within the counting frame.
- When counting, the accuracy of the estimate is unaffected by empty counting frames.
- If the cells are plated unevenly this will result in lots of variability between counting frames (e.g. 3 cells in some frames, 10 cells in others) – this variability is what reduces accuracy and pushes the CE higher. Increasing counting sites may improve this, but it may be difficult to get low CEs with unevenly plated cells.
- If it is necessary to count everywhere (i.e. in the case of very few cells) try to trace around only the locations of the cells at low magnification, excluding areas where there are no cells. To count all cells SRS grid size = counting frame size.
- You will likely need to use different sampling parameters for samples with different cell densities – see the table below as an example where the population of neurons is varying.

STEP 2: Run Petrimetrics to determine average neurite length
- Using the same contour as used to determine cell number, run Petrimetrics – (in the menu: Probes>Petrimetrics)
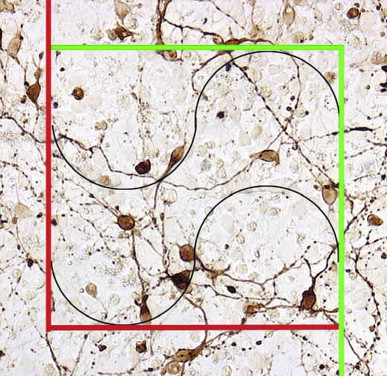
- Petrimetrics maps circular lines onto the counting sites. By clicking at every site a neurite intersects with these lines it is possible to estimate the total length of neurites on the coverslip (for neurites it is recommended to use many small sites with a small Merz diameter)
- When you have completed counting all of the neurite intersections in the first counting frame press F2 to move to the next frame
- Once all the sites have been visited you can view the results of the probe run – (in the menu: Probes>Display Probes Run List)
- The total length of the neurites will be given (there is no CE for this estimate). To obtain the average neurite length divide this number by the total number of cells determined in STEP 1. E.g. Total Neurite Length = 50,000 µm, Total Number of Cells = 1,000 so the Average Neurite Length = 50 µm
STEP 3: /OPTIONAL :Use NeuroExplorer to trace neurons identified during the cell count fractionator
An alternative to counting branch points using the fractionator is to trace neurons in NeuroExplorer following the cell count Fractionator. Using the cells selected using the fractionator (or every second or third cell) ensures that the neurons you are tracing have been selected in an unbiased mannar. Tracing the cells in NeuroExplorer will enable improved statistics, such sholl analysis, to give information on the degree of branching BUT will take longer than simply counting the branching nodes in the Fractionator.
- Save the .dat file from Stereo Investigator once you have traced the coverslip and counted the cells with the Fractionator
- Open this .dat file in NeuroExplorer. Place the reference point and align the tracing with the sample
- Visit the marked cells (or a fraction of these cells) and trace them
- Use Sholl analysis on these traced cells